Water Temperature in Loreto Baja California Mexico
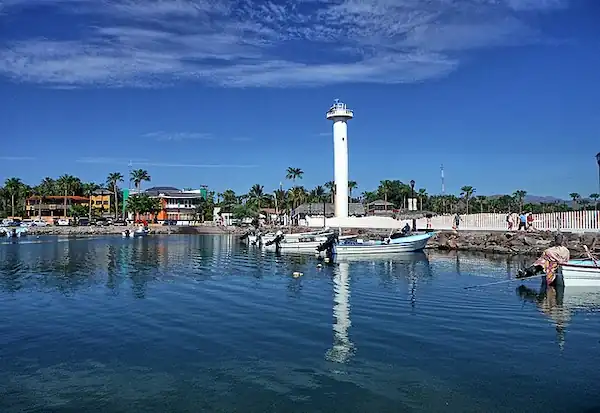
As a lover of Loreto’s beaches, I know that the Water Temperature and climate are key to a perfect vacation in Baja California Sur, Mexico.
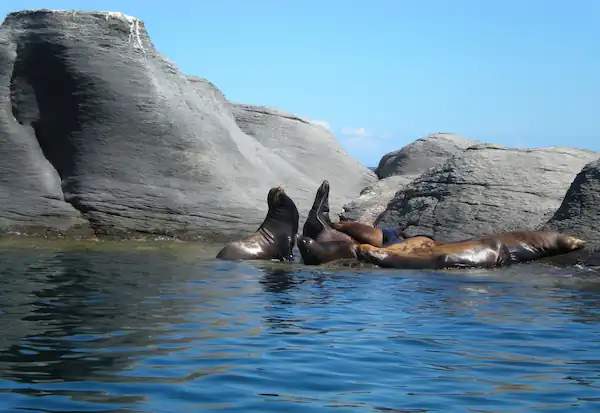
Here is the analysis with updated data and the monthly forecast so you know exactly what to expect before diving into the Gulf of California, known as the “World’s Aquarium.”
Water Temperature and Climate in Loreto, BCS with Current Data, Historical by Month, and Forecast
| Month | Min. Average | General Average | Max. Average | Comfort Rating |
| January | 62.6°F / 17.0°C | 67.3°F / 19.6°C | 73°F / 22.8°C | Cold / Mild |
| February | 61.3°F / 16.3°C | 66.4°F / 19.1°C | 71.6°F / 22.0°C | Cold |
| March | 62.4°F / 16.9°C | 67.6°F / 19.8°C | 74.1°F / 23.4°C | Cold / Mild |
| April | 65.8°F / 18.8°C | 70.9°F / 21.6°C | 77.5°F / 25.3°C | Mild |
| May | 67.8°F / 19.9°C | 75°F / 23.9°C | 81.5°F / 27.5°C | Mild / Warm |
| June | 73.9°F / 23.3°C | 79.5°F / 26.4°C | 85.8°F / 29.9°C | Warm |
| July | 77.7°F / 25.4°C | 83.3°F / 28.5°C | 88.7°F / 31.5°C | Very Warm |
| August | 81°F / 27.2°C | 85°F / 29.4°C | 90.5°F / 32.5°C | Very Warm (Peak) |
| September | 81°F / 27.2°C | 85°F / 29.4°C | 90°F / 32.2°C | Very Warm (Peak) |
| October | 75°F / 23.9°C | 82°F / 27.8°C | 90°F / 32.2°C | Very Warm |
| November | 68°F / 20.0°C | 77°F / 25.0°C | 86°F / 30.0°C | Warm |
| December | 63°F / 17.2°C | 71°F / 21.7°C | 79°F / 26.1°C | Mild |
Ocean Salinity and Swimming Comfort
The Sea of Cortez is slightly saltier than the global average (about 35.28‰ vs. 35‰). This small difference provides excellent buoyancy, making swimming and snorkeling in Loreto easier.
When water temperature is this warm, swimming is comfortable even for young children or older adults.
Remember: these conditions are perfect as long as the weather is clear.
Historical Analysis and Sea Temperature Forecast
Experts use a dynamic table to evaluate trends. By reviewing recent data and comparing it with historical averages, we confirm that we are in an excellent period.
Methodology and Data Sources (NOAA, Proprietary Models, Buoys)
To ensure reliability, this information is gathered from various high-precision sources, including daily satellite readings from the NOAA (National Oceanic and Atmospheric Administration), real-time buoy data, and advanced mathematical models that consider local climate and currents.
Local Temperature Variations (Winds, Depth, Rainfall)
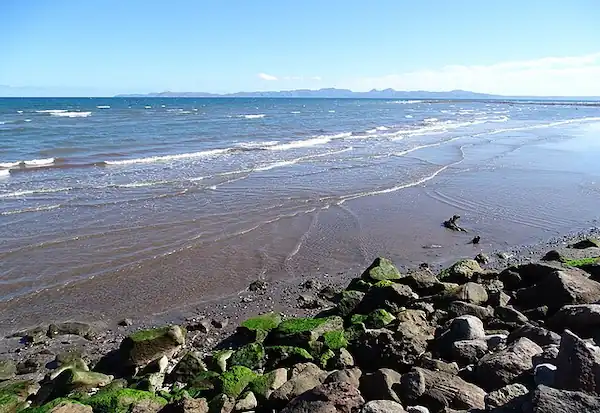
Keep in mind that the temperature you feel near the shore may vary slightly. Factors like wind direction (which can push colder or warmer surface water), recent rains, or sampling depth may cause small fluctuations of 1–2 degrees.
Annual and Seasonal Trends
Loreto’s sea water is fantastic because it allows swimming all year round, as the water rarely drops below 68°F or 20°C.
Swimming and Warm Water Days (Comfort Levels)
- The water is above 77°F (25°C) for about 171 days per year.
- The water is above 72°F (22°C) for about 231 days per year.
The Best and Worst Month for Swimming
- Warmest Month (Ideal): August and September, with maximum average temperatures nearing 86°F – 90°F.
- Coldest Month (Still Suitable): February and March, although the general average for those months is around 66°F to 67°F. If traveling during these months, consider a light wetsuit for longer dives.
Visit our English version about Temperatura del Agua y Clima en Loreto Baja California México